
Current all-in BESS capex clusters around a central benchmark of roughly $125 per kWh, with a plausible range depending on duration, location, and procurement strategy. The single most useful modeling move you can make is to stop quoting one blended number and instead separate every bid into its energy ($/kWh) and power ($/kW) components. A sample input set for your spreadsheet follows below.
TL;DR:
- Costs vary significantly with interconnection, local content requirements, and permitting, with some projects exceeding $155 per kWh due to delays or high overheads.
- Itemizing the capex into battery, power conversion, balance of system, controls, and soft costs reveals hidden expenses that escalate budgets during construction.
- Longer-duration systems reduce $/kWh by spreading fixed power costs over more energy but increase $/kW, affecting project economics depending on use case.
- Recent benchmarks place the all-in cost of long-duration storage at around $125 per kWh, but regional factors and procurement strategies influence the final price.
- Early-stage planning should include thorough interconnection studies, explicit contingency clauses, and phased procurement to avoid cost overruns and scope creep.
Table of Contents
- Current benchmarks and what recent auctions tell us
- BESS cost components: itemized breakdown and typical ranges
- How scale and duration change the cost metric
- Operating costs, degradation, and the LCOS concept
- Regional and project-specific drivers of cost variance
- A developer-ready checklist and sample inputs
- What procurement teams consistently underestimate
- How packaged energy storage products simplify your budget
- FAQ
- Sources
Current benchmarks and what recent auctions tell us
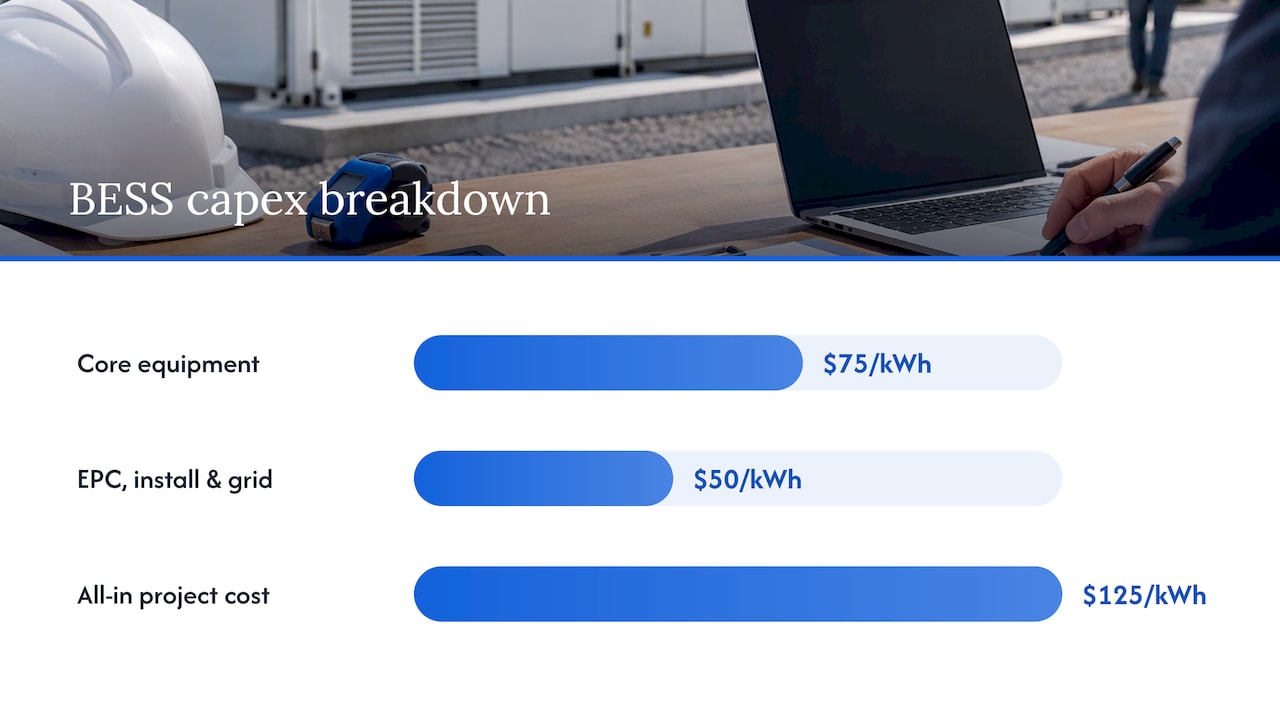
The clearest recent synthesis comes from auction-backed analysis showing an all-in capex of about $125 per kWh for long-duration (four-hour-plus) utility-scale battery systems across global markets outside the US and China. That figure typically splits into two halves: core equipment at roughly $75 per kWh and EPC, installation, and grid connection at around $50 per kWh.
A representative long-duration BESS project today lands near $125/kWh all-in, translating to a levelized cost of storage near $65 per MWh. That LCOS figure matters for anyone pairing storage with solar: shifting half of a solar plant’s output to evening hours at that cost adds roughly $33 per MWh to the blended cost of solar power.
The plausible range around that central estimate spans roughly $100 to $155 per kWh, depending on how competitively equipment is sourced and how local the EPC tender is. A few patterns show up consistently across recent procurement rounds:
- Markets with competitively tendered equipment, often Chinese-manufactured cells and inverters, combined with local EPC contracting tend to land near the $120 to $130 per kWh band.
- Saudi Arabia, India, and Italy have all produced auction results that reinforce this clustering, though each carries its own interconnection and permitting overhead.
- Grid connection costs and local regulatory requirements, not equipment price, usually explain the widest swings between projects.
- Markets with constrained interconnection queues or heavy import duties push well above the central range regardless of equipment cost.
Pricing has trended downward over the past several cycles as cell manufacturing capacity expanded and EPC firms gained experience with standardized container designs. The exceptions worth flagging early: markets with lengthy interconnection studies, high local-content requirements, or thin EPC competition, where costs can sit well above $155 per kWh even with cheap cells.
BESS cost components: itemized breakdown and typical ranges
A capex budget for a battery energy storage system is not one number. It is a stack of distinct cost categories, each with its own drivers, and treating the whole thing as a single line item is how budgets go wrong at financial close.
- Battery pack and cells, the energy-rated portion of the system, typically represents the largest single cost driver and scales directly with $/kWh pricing and chemistry choice.
- Power conversion equipment, including the PCS, inverter, step-up transformer, and switchgear, scales with power rating ($/kW) rather than energy capacity and does not shrink as duration increases.
- Balance of system, covering enclosures, thermal management, fire suppression, and racking, adds a layer of cost tied more to footprint and safety code than to battery chemistry.
- Controls and integration, meaning the energy management system, SCADA, PCS integration work, and commissioning testing, is often underestimated in early-stage budgets.
- Soft costs, which include permitting, interconnection studies, developer overhead, and contingency reserves, can add a meaningful percentage on top of hardware and installation even before construction begins.
The EPRI installed-cost assessment breaks these categories down further and flags a recurring issue: many turnkey EPC quotes exclude land acquisition and interconnection costs entirely, leaving developers to discover those line items later in the process. EPRI also reports typical operations and service-agreement ranges between $2 and $14 per kW-year, a spread wide enough to materially change a project’s lifetime cost projection depending on which contractor you select.
Pro Tip: Ask every EPC bidder to itemize their quote into battery pack, power equipment, BOS, and soft costs separately. A single lump-sum number hides which contractor is actually competitive on the components that matter for your project.
The practical implication for anyone building a capex model: request itemized quotes along these five categories rather than accepting a blended $/kWh or $/kW figure from a vendor. A bid that looks cheap on an all-in basis can hide an inflated soft-cost allocation or an undersized BOS budget that resurfaces as a change order during construction.
How scale and duration change the cost metric
The ATB 2025 bottom-up model decomposes total system cost into a formula that every developer should have memorized before reviewing a term sheet:
Total system cost ($/kW) = battery cost ($/kWh) × duration (hours) + balance-of-system cost ($/kW)
This formula explains a pattern that confuses newcomers to storage economics: a longer-duration system looks cheaper on a $/kWh basis but more expensive on a $/kW basis, and both statements are true simultaneously.
- As duration increases from two to ten hours, the fixed power-related costs (PCS, transformer, switchgear) get spread across more energy capacity, pulling down the $/kWh figure.
- The same fixed costs, measured against the power rating, do not shrink, so total system cost per kW of power rises with duration.
- A developer sizing a project around grid services (frequency regulation, short-duration arbitrage) should model in $/kW terms; one targeting long-duration energy shifting should model in $/kWh terms.
A worked example: a 60 MW, four-hour system has 240 MWh of energy capacity. Using the Ember-derived benchmark of $125 per kWh all-in, that yields a total project cost near $30 million, or roughly $500,000 per MW of power capacity.
Operating costs, degradation, and the LCOS concept
Capex tells you only part of the economic story. Levelized cost of storage (LCOS) converts the full lifetime cost, capex plus operations, minus any residual value, into a dollar-per-MWh figure comparable across technologies and durations. The PNNL/DOE LCOS methodology organizes lifecycle costs into three buckets: procurement, installation, and connection; ongoing operations and maintenance; and end-of-life handling.
Ember’s modeling puts LCOS at roughly $65 per MWh for a typical long-duration project built at $125/kWh capex. That figure depends on several inputs that each deserve their own line in your model:
- Fixed O&M typically runs near 2% of capex per year, covering scheduled maintenance, monitoring, and service agreements.
- Round-trip efficiency losses reduce the usable energy throughput against which capex is amortized, directly affecting the denominator in any $/MWh calculation.
- Degradation rates reported by manufacturers often sit at or below 2% per year, though actual field performance varies by chemistry, cycling depth, and thermal management quality.
- Discount rate assumptions, often the most contentious input in a financing model, can shift calculated LCOS by a wide margin between a conservative and an aggressive cost of capital.
- Utilization, meaning how many full cycles the system actually runs per year, determines whether the fixed capex gets amortized across enough throughput to hit the modeled LCOS.
A project modeled at low utilization or a high discount rate can see its effective $/MWh cost rise well above the $65 benchmark even with identical hardware costs, which is why LCOS sensitivity tables matter more than a single point estimate in investment committee materials.
Regional and project-specific drivers of cost variance
Two projects with identical battery chemistry and power rating can land tens of dollars per kWh apart once you account for site-specific conditions. Interconnection upgrades are consistently the largest single source of that variance: depending on grid congestion and required upgrades, interconnection costs alone can add anywhere from roughly $30 to more than $100 per kWh to a project’s effective capex.
- Import duties and local-content requirements can push equipment costs up well beyond the competitively tendered benchmark, particularly in markets that mandate domestic manufacturing content.
- Labor rates and permitting timelines shift the EPC half of the cost stack, often more than the equipment half, especially in markets with limited experienced storage contractors.
- Land acquisition and site civil work, frequently excluded from turnkey EPC quotes, need their own line item and their own contingency.
Pro Tip: Commission your interconnection study before finalizing equipment procurement. It is the single input most likely to blow through an early-stage budget, and knowing the upgrade scope early lets you negotiate contract clauses that cap your exposure.
The procedural fix is straightforward: scope interconnection early, treat land assumptions as placeholders until confirmed, and write contingency and change-order clauses into EPC contracts that explicitly cap how much scope creep can shift the final price.
A developer-ready checklist and sample inputs
Before you build a capex and LCOS model, gather these inputs. Each one maps to a specific line in the formula and benchmark data discussed above.
- Energy cost in $/kWh, sourced from recent competitive quotes or the Ember/ATB benchmark range.
- Balance-of-system cost in $/kW, covering PCS, transformer, and switchgear.
- EPC and installation cost as a separate line, not bundled into equipment pricing.
- Contingency reserve, typically a percentage of total hard costs.
- Fixed O&M as a percentage of capex per year.
- Annual degradation rate and an augmentation schedule to replace lost capacity.
- Discount rate assumption for the LCOS calculation.
- Expected utilization in cycles or full-power-hours per year.
- Project lifetime in years.
Starting from the central column, a 240 MWh project at $125/kWh capex and $65/MWh LCOS gives you a working baseline. Swap in your own EPC quotes, interconnection study results, and financing terms as they firm up, and the model updates without needing to rebuild its structure. The bottom-up decomposition from ATB and the OSTI cost projections are worth keeping open alongside this table since both publish multi-scenario forecasts useful for stress-testing your central estimate against a 2030 or 2035 procurement timeline.
What procurement teams consistently underestimate
Having reviewed how these budgets get built and where they break, the recurring failure point is not technical. It is sequencing. Teams lock equipment pricing before they understand their interconnection scope, then discover the grid upgrade costs more than the discount they negotiated on cells.
Negotiate payment terms that tie milestones to commissioning performance, not just delivery, and push for explicit augmentation liability language in warranty terms rather than assuming degradation risk sits with the owner by default. Lock EPC scope only after the interconnection study closes, not before. Mapped against your budget, battery and power equipment sit in your capex line, enclosures and thermal management sit in BOS, and EMS integration sits in your controls line. None of this changes by vendor, only by how disciplined the sequencing is.
— Hu
How packaged energy storage products simplify your budget
Containerized and pre-integrated systems can help collapse the line items that cause the most budget uncertainty. Our Energy Storage Container line ships with PCS and EMS pre-integrated at the factory, shifting work out of the on-site EPC schedule and into a controlled manufacturing environment.
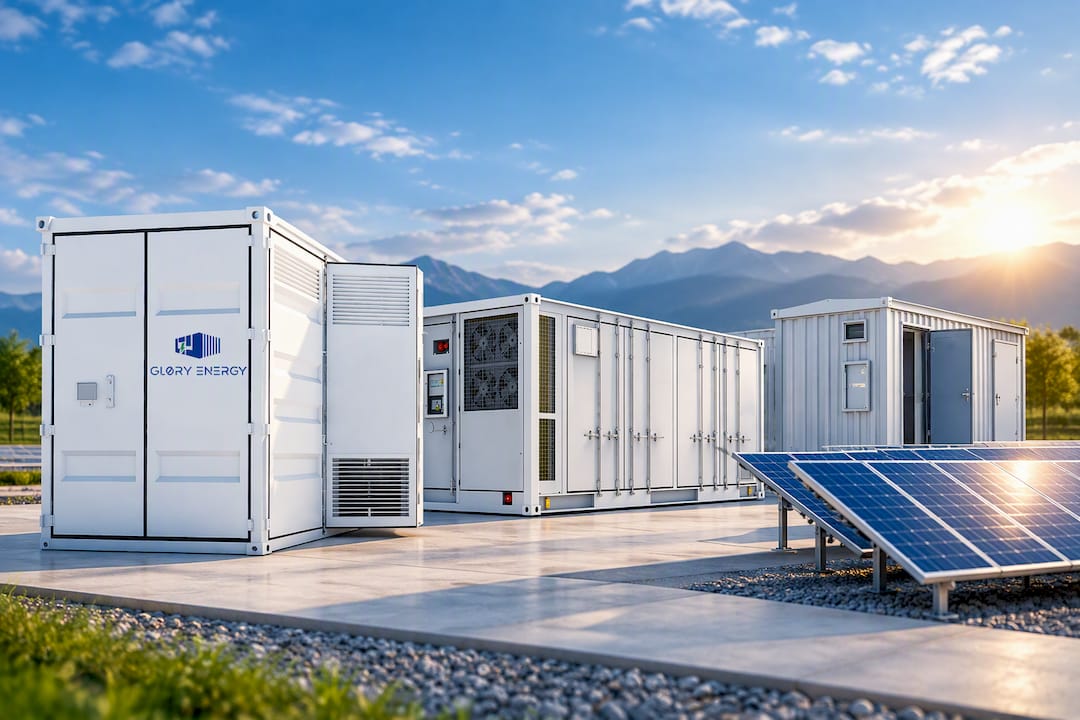
- Our Mobile PV-BESS Power Station pairs generation and storage in one deployable unit, reducing site civil and interconnection scope for smaller or temporary installations.
- Our ODM/OEM Energy Storge Container option lets you specify configuration while we handle factory assembly, cutting the BOS and controls integration work that typically runs over budget on-site.
- Our E-House units arrive factory-built and tested, removing a major source of on-site EPC risk and schedule slippage.
Browse our full product catalog or reach out to request a project-specific quote mapped to your capacity and duration targets.
FAQ
What is the typical price per kWh for battery storage?
Recent auction-backed analysis puts all-in utility-scale BESS costs at roughly $125 per kWh for long-duration systems, split into about $75/kWh for core equipment and $50/kWh for EPC and installation. Actual pricing in any single market depends heavily on interconnection costs, import duties, and local EPC competition.
What are the key components of a BESS project?
A BESS project budget breaks into battery cells and modules, power conversion equipment (PCS, transformer, switchgear), balance of system (enclosures, thermal management, fire suppression), controls and integration (EMS, SCADA, commissioning), and soft costs (permitting, interconnection studies, contingency). The EPRI installed-cost assessment notes that turnkey quotes often exclude land and interconnection, so those need separate budget lines.
How long will a 10 kWh battery power a house?
How long a 10 kWh battery lasts depends entirely on household load and how much of that capacity is usable, since most systems reserve some charge to protect battery life. This is a sizing question specific to appliance load and usage patterns rather than a fixed project-cost figure covered by utility-scale benchmarks.
How much does a 1 MW BESS cost?
Cost for a 1 MW system depends on its duration, since storage pricing scales with energy capacity (kWh) more than power rating alone. Using the benchmark of $125 per kWh, a 1 MW, four-hour system would cost roughly $500,000 on an all-in basis, before accounting for site-specific interconnection or permitting costs.
What drives the biggest cost differences between BESS projects?
Interconnection upgrade requirements typically cause the widest swings between projects, adding anywhere from roughly $30 to more than $100 per kWh depending on grid congestion. Import duties, local-content rules, and permitting timelines in a given market also shift the EPC half of project cost significantly.
Sources
- How cheap is battery storage? | Ember
- Utility-scale battery storage | ATB 2025
- Energy storage cost & performance | PNNL
- Cost projections for utility-scale battery systems (OSTI)